Open Access
3 November 2018 Fully automated dual-resolution serial optical coherence tomography aimed at diffusion MRI validation in whole mouse brains
Author Affiliations +
Fig. 1
Main components of the dual-resolution serial OCT setup. FC, fiber coupler; COL, collimator; PC, polarization controller; BPD, balanced photodetector; FM, motorized flip mirror; DCC, dispersion compensation cube; ODC, objective dispersion compensator; ND, variable neutral density filter; M, mirror; ADC, analog-digital converter; FPGA, field-programmable array; and DAQ, data acquisition card.

Fig. 2
Automated 40× OCT ROIS generation method: (a) AIP of a 3× OCT mouse brain tissue slice, (b) tissue mask and 0.25-mm margin from the agarose/tissue boundary (red line), (c) probability bias used to guide the random ROI generation, (d) 25 ROIs of shape 0.5×0.5  mm generated for this slice, and (e) 3D rendering of the 40× ROIs (red) generated for an automated 2R-SOCT.

Fig. 3
Multimodal and multiresolution coregistration workflow. In this illustration, all templates are shown at a resolution of 25  μm, the 3× OCT slice is at a resolution of 15  μm, the 40× OCM images are at a resolution of 1  μm and the dMRI B0 map is shown at a resolution of 125  μm. The red lines shown in the Allen mouse brain template represent the brain structure boundaries as obtained from the Allen mouse brain atlas.

Fig. 4
Example of 3× ROIs (a) without and (b) with registration and (c) their associated 40× ROIs. As shown by this example, the OCM to OCT registration is essential to find the accurate position of the 40× ROIs within the 3× OCT whole mouse brain.

Fig. 5
Multimodal signal comparison performed between the 2R-SOCT and the dMRI data. The 3× SOCT (green) is used to image a whole mouse brain that serves as a stereotactic reference to locate the 40× ROIs (red) within the dMRI volumes (blue). The OCT brain slice represented on the right (green inset) was coregistered to the dMRI data with a series of rigid and affine transforms. Scale bar: 2 mm.

Fig. 6
Example of a dual-resolution fixed-focus mosaic acquisition: (a) manual selection of the region of interest to be imaged (green polygon), (b) 3× OCT mosaic acquired at the defined ROI position, and (c) same region acquired with the 40× objective, assembled without preprocessing and blending. Each mosaic tiles have an FOV of 0.5×0.5  mm2 and an overlap of 20%. Scale bar: 250  μm.

Fig. 7
Dual resolution OCT acquisition showing the cc and cingulate bundle in a mouse brain: (a) low-resolution OCT volume used to target the high-resolution ROI (red rectangle), (b) maximum intensity projection, (c) AIP of the high-resolution OCM volume acquired, and (d) AIPs over 30  μm of the OCM volume. The scale bars are of size 0.5 mm for the 3× image and 100  μm for the 40× image.

Fig. 8
AIPs of the dual-resolution ROIs acquired automatically within a single mouse brain. (a) OCT ROIs acquired with the low-resolution 3× objective and (b) the same OCM ROIs acquired with the high-resolution 40× objective. Each ROI is of size 0.5×0.5  mm2.

Fig. 9
3-D rendering of all 40× ROIs of this study from three 2R-SOCT mouse brain acquisitions. All ROI overlay volumes were aligned to an OCT mouse brain template, shown here as a grayscale average intensity. The ROI position of the blue and red blocks was selected automatically by the 2R-SOCT ROI selection method, and the green blocks were selected manually by the microscope operator. This is a still frame from the video. (Video 1, MP4, 2.2 MB[URL: https://doi.org/10.1117/1.NPH.5.4.045004.1]).).

Fig. 10
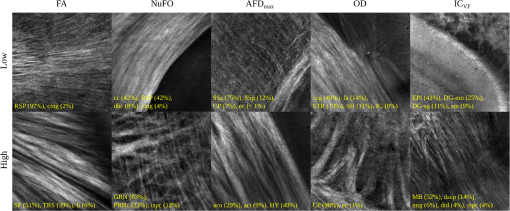
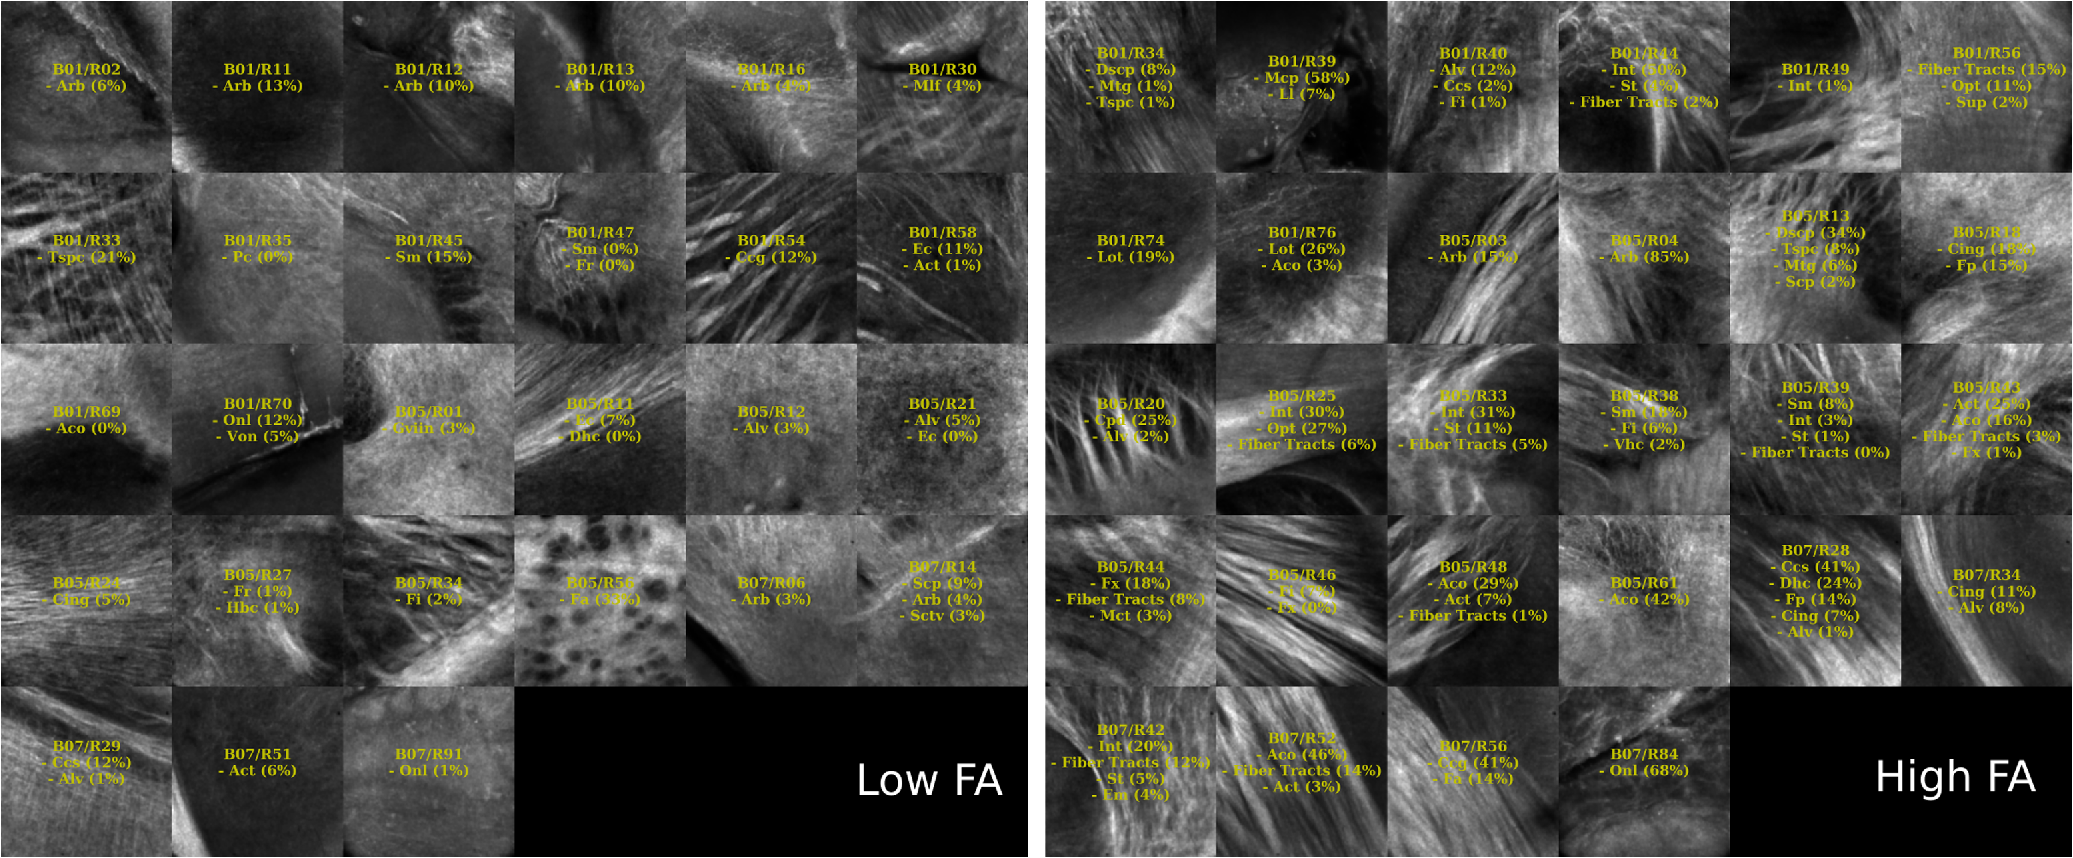
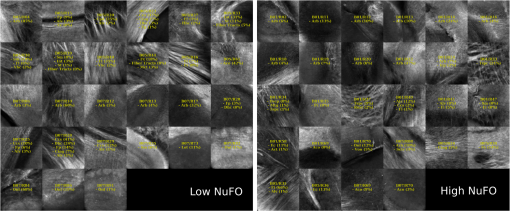
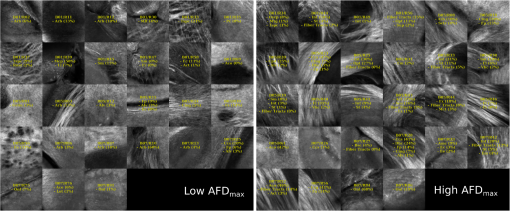
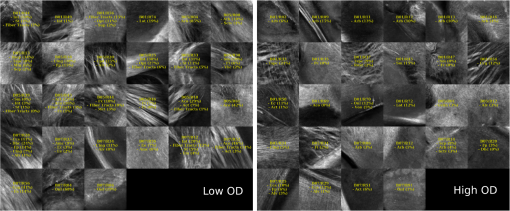
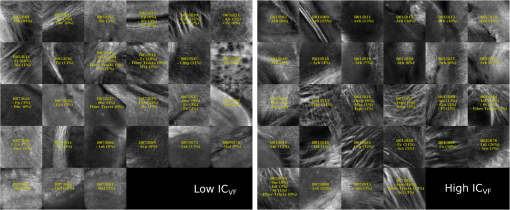
Examples of 40× ROIs associated with low- and high-dMRI measure values. Each image spans an FOV of 0.5×0.5  mm2 and is an AIP over 250  μm. The yellow annotations indicate the brain structures and their volume fraction within the ROIs. The acronyms follow the Allen mouse brain convention. RSP, retrosplenial area; cing, cingulum bundle; SF, septofimbrial nucleus; TRS, triangular nucleus of septum; fi, fimbria; cc, corpus callosum; dhc, dorsal hippocampal commissure; GRN, gigantocellular reticular nucleus; PRNc, pontine reticular nucleus caudal part; tspc, crossed tectospinal pathway; SSs, supplemental somatosensory area; SSp, primary somatosensory area; CP, caudoputamen; ec, external capsule; aco, anterior commissure olfactory limb; act, anterior commissure temporal limb; HY hypothalamus; ccg, genu of the corpus callosum; fa, corpus callosum anterior forceps; STR: striatum; SH, septohippocampal nucleus; IG, induseum griseum; EPI, epithalamus; DG-mo, dentate gyrus-molecular layer; DB-sg, dentate gyrus-granule cell layer; sm stria medullaris; MB, midbrain; dscp, superior cerebellar peduncle decussation; mtg, mammilotegmental tract; dtd, doral tegmental decussation; and tspc, crossed tectospinal pathway.

Fig. 11
Comparison between simple OCM image features the dMRI metrics. Each histogram represents the OCM values classified within the low- (blue) and high- (orange) dMRI metric quantiles. The red stars indicate significant differences obtained from a T-test between all pairs of low-/high-metric values, corrected for multiple comparisons (p<0.0025).

Fig. 12
40× ROIs classified within the low- (<25% quantile) and high- (>75% quantile) FA groups. The yellow texts indicate the fiber tract structures within each ROIs, using the Allen mouse brain atlas structure acronyms.

Fig. 13
40× ROIs classified within the low- (<25% quantile) and high- (>75% quantile) NuFO groups. The yellow texts indicate the fiber tract structures within each ROIs, using the Allen mouse brain atlas structure acronyms.

Fig. 14
40× ROIs classified within the low- (<25% quantile) and high- (>75% quantile) AFD_max groups. The yellow texts indicate the fiber tract structures within each ROIs, using the Allen mouse brain atlas structure acronyms.

Fig. 15
40× ROIs classified within the low- (<25% quantile) and high- (>75% quantile) OD index groups. The yellow texts indicate the fiber tract structures within each ROIs, using the Allen mouse brain atlas structure acronyms.

Fig. 16
40× ROIs classified within the low- (<25% quantile) and high- (>75% quantile) IC_VF groups. The yellow texts indicate the fiber tract structures within each ROIs, using the Allen mouse brain atlas structure acronyms.

Lens.org Logo
CITATIONS
Cited by 8 scholarly publications.
Advertisement
Advertisement
KEYWORDS
Brain

Optical coherence tomography

Tissues

Neuroimaging

Diffusion magnetic resonance imaging

Image registration

Image resolution

Back to Top